19 Asset-Dependency Networks (Econophysics) — Paper Review & Platform Fit Findings
Date: 2026-07-30 Reviewer: initial reasoned-analysis pass (operator-requested) Source paper: Raddant, M. & Di Matteo, T. (2023). A look at financial dependencies by means of econophysics and financial economics. Journal of Economic Interaction and Coordination 18:701–734. DOI 10.1007/s11403-023-00389-6. Open access (CC-BY 4.0). Question posed: Does introducing a connected network of assets improve the platform’s model, and how much change would it require?
Result up front. We ran a read-only empirical spike to pressure-test the one recommended path — a Diebold–Yilmaz connectedness index used as a leading regime signal. The leading-signal hypothesis failed: on this platform’s own universe the index is coincident with realised volatility, not ahead of it (§6). We therefore recommend not building a time-series connectedness index in the expectation that it anticipates stress. The full reasoning follows.
⚠️ This is a reasoned-analysis and research-spike findings document, not a producer or a validated edge. No production code was changed (read-only spike). It exists to inform a go/no-go on a future design brief.
19.1 1. What the paper actually is
A 2023 survey / review — not a single method with a backtested edge. It tours the econophysics and financial-economics toolkit for modelling the N×N dependency structure among assets as a network. Load-bearing techniques it catalogues:
| Technique | What it produces | Maturity in the paper |
|---|---|---|
| Correlation matrix (Pearson, exp-weighted, partial, rank/tail) | dense N×N dependency | foundational |
| Random Matrix Theory / PCA | denoised covariance, “market mode” + group modes | foundational |
| Information filtering networks — MST, PMFG, TMFG + DBHT clustering | sparse graph (N−1 or 3(N−2) edges) + endogenous clusters | the paper’s centrepiece |
| Multivariate GARCH (DCC/BEKK/DECO) | dynamic conditional covariance | mature but hard to scale |
| Granger-causality / pairwise de-GARCHed regression | directed lead-lag network | explicitly weak — Billio et al.: significant links barely exceed the 5% false-positive rate except during crises |
| Diebold–Yilmaz variance decomposition / TVP-VAR | directed spillover / connectedness network → systemic-risk proxy | the most cited applied one |
Crucial framing: none of these are presented as alpha. The paper’s own applications are risk topology, systemic risk, comovement / segmentation, and covariance denoising — descriptive structure, not return prediction.
19.2 2. Does the “connected network of assets” improve the platform’s model?
It depends entirely on which of three distinct value propositions you mean. Conflating them is where this kind of idea usually goes wrong. Two of the three are a poor fit for this platform specifically.
19.2.1 2.1 As an alpha source (network structure → return prediction) — Recommend against
The only genuinely return-predictive angle is economic-links / lead-lag momentum (Cohen–Frazzini, Granger networks). The paper itself flags it as regime-dependent and barely-above-noise outside crises. The platform already has a rigorous factor → signal → ranked-cross-section pipeline with an honest verdict that purged-cross-validation information coefficient is approximately zero on the current predictor set; a weak, fragile network-alpha signal buys little and adds a lot of surface.
19.2.2 2.2 As a portfolio-optimiser input (denoised/filtered covariance → weights) — Recommend against, on principle
This is the classic RMT + TMFG-LoGo payoff: a better-conditioned covariance matrix for mean-variance optimisation. But the architecture rests on a repeatedly reaffirmed settled decision — the construction and allocation layers are compliant-by-construction, not optimisers: no covariance inversion, no objective function. Adopting the covariance-optimisation payoff would silently reverse a deliberate architectural stance. A survey paper should not be allowed to relitigate that decision as a side effect.
19.2.3 2.3 As a risk / crowding / systemic-observability layer — This is the real fit, and it’s a good one
Where the concept genuinely earns its place — and where the platform is already leaning:
- The platform’s momentum-crowding monitor is already a correlation-network statistic — abnormal within-decile return correlation among the momentum family (comomentum). The paper is the general theory of exactly that move.
- The equity risk model already carries a factor covariance and idiosyncratic variance model.
- The information-coefficient layer already builds a factor-level pairwise correlation network.
So the network concept is not foreign — it exists at the factor level and in crowding. What is genuinely missing is an asset-level dependency / connectedness read: a market-wide “how correlated / fragile is the whole book right now” regime signal, plus network-based clustering to (a) sanity-check sector neutralisation, and (b) detect concentration / crowding in the traded cross-section that sector labels miss.
The single highest-value, lowest-regret extraction from this paper is Diebold–Yilmaz total connectedness as a report-only systemic-risk / regime diagnostic, optionally paired with TMFG + DBHT clustering of the universe. That fits the platform’s established grammar exactly: one method per package, report-then-enforce, research evidence and sidecar surfaced on the operator dashboard, evidence-first, no gate at first — the momentum-crowding monitor is the literal precedent.
19.3 3. Effort to bring it in
Scoped against the momentum-crowding precedent (roughly 600 lines of math and service, plus a close-out producer, a research-evidence table, a sidecar, and one dashboard card). Three tiers:
| Tier | Scope | Rough effort | Risk |
|---|---|---|---|
| A — Diebold–Yilmaz connectedness diagnostic (recommended MVP) | One new producer: rolling VAR + generalised FEVD over a sector/index return panel → total & directional connectedness index → research-evidence table + sidecar → one regime card. Report-only, no gate. | ~1 small epic / 4–6 tasks, comparable to the crowding monitor. Math is standard statsmodels VAR. | Low — no portfolio/gate coupling. |
| B — TMFG + DBHT universe clustering | Add filtered-graph + clustering producer over the correlation matrix; surface network-clusters versus sectors as an integrity / observability panel; feed a crowding / concentration read on the traded book. | +1 epic / 5–8 tasks. The TMFG + DBHT graph algorithms are the only genuinely new machinery — no currently-vendored library does them, so hand-rolled (Massara et al. 2017 is the scalable reference). | Medium — algorithmic surface; needs its own tests. |
| C — Dynamic conditional covariance / network-aware sizing | DCC-GARCH covariance feeding diversification-aware sizing in the allocation layer. | Large / multi-epic, and collides with the no-optimiser stance. | High — don’t, unless that stance is being revisited deliberately. |
19.4 4. Recommendation
Original recommendation (pre-spike): do Tier A only, as a report-only observability producer, and gate any move toward B/C on Tier A actually showing a connectedness signal that leads regime shifts.
Revised recommendation (post-spike, §6): the Tier-A leading-signal premise did not hold on this platform’s universe — the total connectedness index is coincident, not leading, has a saturated / narrow dynamic range at sector granularity, misses equity-specific selloffs, and is contaminated by composition drift. So:
- Do not build the Tier-A time-series connectedness index as a regime predictor. Its marginal information over just watching realised volatility is low, and it does not anticipate stress.
- If a network producer is still wanted, the surviving rationale is the cross-sectional crowding / clustering angle (Tier B — TMFG/DBHT on the traded book, “which of my current holdings are one correlated cluster”), not the market-wide connectedness index. That is a different, heavier build and should get its own spike before commitment.
- Everything worth having remains reachable without touching the construction or allocation layers or the no-optimiser stance; everything that would touch them is weak (alpha, §2.1) or against a settled decision (optimiser, §2.2). Unchanged.
Honest caveat (reaffirmed): this is a survey — no published edge to import. The spike confirms the concept’s value here is at best coincident risk legibility, not P&L or early warning.
19.4.1 Suggested next step (pick one)
- Shelve the network work — the cheapest spike killed the strongest hypothesis; a coincident-with-volatility index isn’t worth a producer. (Recommended default.)
- Tier-B spike — if the crowding / clustering use still appeals, run a cross-sectional spike: TMFG/DBHT-cluster the current traded book and measure whether within-cluster concentration would have flagged real drawdown episodes. Only then consider a brief.
Tier-A design brief— withdrawn; §6 removes its justification.
19.5 5. Reference-paper capture (convention reminder)
By our reference-paper convention, any cited paper must be captured in the Reference Library. This paper is open-access (CC-BY); if a design brief proceeds, add its bibliography row and bundle the PDF as Raddant2023-financial-dependencies-econophysics.pdf. Not done here (no code or brief committed yet) — flagged so it isn’t missed at brief time.
19.6 6. Empirical research spike (2026-07-30) — does connectedness lead stress?
Read-only spike against the platform’s end-of-day price history. Goal: de-risk Tier A before any brief by testing its load-bearing premise — that a Diebold–Yilmaz total connectedness index would give an early-warning regime signal in this platform’s own universe.
Bottom line: the index is a coincident echo of realised volatility, blind to equity-specific selloffs, and sensitive to universe composition — it does not lead stress. This is a single exploratory, in-sample spike; we do not attach bootstrap intervals to the correlations below, and read them as a directional read rather than a calibrated estimate.
19.6.1 6.1 Method
- Panel: sector-level daily equal-weight mean log return, built in DuckDB from the end-of-day adjusted-close facts joined to the instrument sector key. Cross-section restricted to liquid, non-fund names (adjusted close ≥ $5, 20-day dollar volume ≥ $1M, per-name return clipped to ±0.5 to guard split / data artefacts). Result: 5,698 trading days (2004-01-01 → 2026-07-29) × 11 sectors.
- Estimator: rolling 200-day VAR(2) → moving-average representation → generalised (order-invariant) FEVD (Diebold–Yilmaz 2012) at horizon H = 10 → row-normalised → connectedness index = 100 × off-diagonal mass / N, stepped every 5 days (1,100 points).
- Stress proxy: 21-day rolling annualised realised volatility of the equal-weight market (mean-sector) return.
- Tests: (a) correlation of the index with forward volatility at horizons h = 0 / 10 / 21 / 42 days — rising with h ⇒ leads; falling ⇒ coincident/lagging. (b) lead/lag cross-correlation of the change in the index against the change in volatility. (c) crisis-window peak index versus full-sample median.
19.6.2 6.2 Results
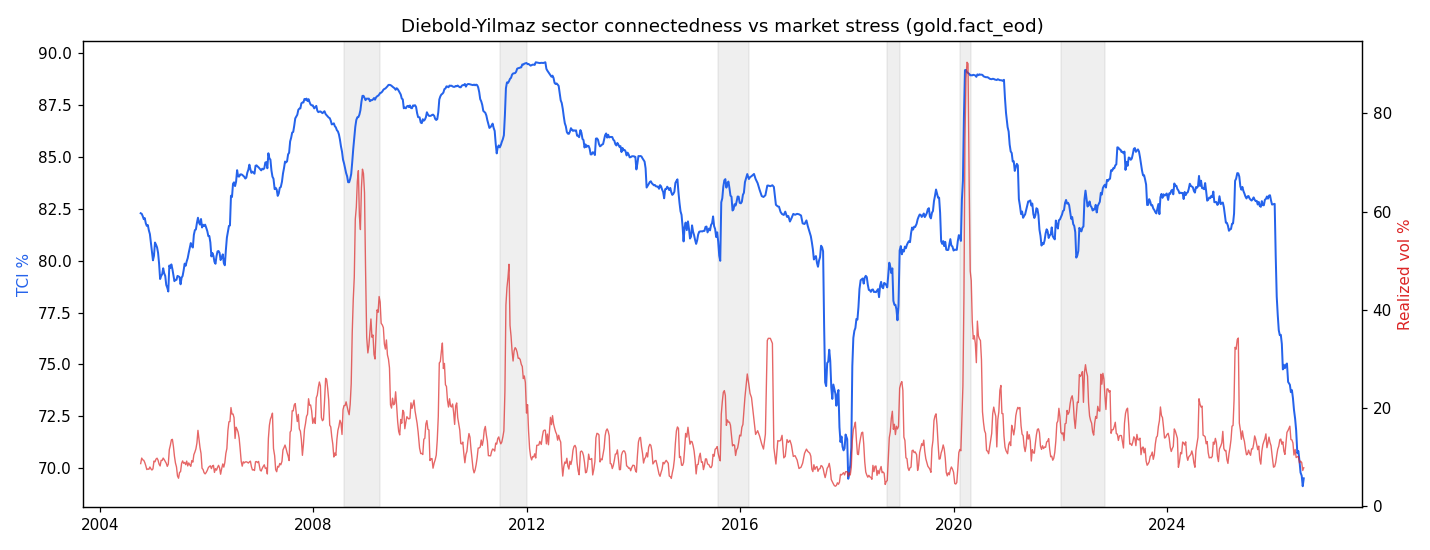
- The index is coincident, not leading. Its correlation with forward volatility is +0.42 (h = 0) → +0.38 → +0.31 → +0.24 (h = 42d) — monotonically declining with horizon, the opposite of a leading indicator. Cross-correlation of changes peaks at lag 0 (+0.35) and goes flat/negative at positive (index-leads) lags (−0.17 at +5d). The change-form has a weak forward blip at h = +10d (+0.29) but nothing that would time a regime.
- Saturated, narrow dynamic range. Index mean 83.6%, band 69–90%. At sector granularity sectors are ~84% connected always; crises add only a few points.
- Flags the big systemic crises, misses equity-specific ones. Peak-versus-median: Global Financial Crisis +4.5, Euro crisis 2011 +6.0, COVID +5.7 — but Q4-2018 −3.0 (below median), 2015-16 +0.7, the 2022 rate shock +0.1. And the systemic peaks land at the crisis bottom (Global Financial Crisis peak 2009-03-26; COVID peak 2020-03-25) — coincident/lagging, not early.
- Composition drift contaminates the level. Large multi-year swings unrelated to stress (secular decline 2012→2018, a structural step around 2017-18, a sharp drop at the very end of sample) track changing cross-section membership / coverage more than market regime — a robustness problem for any thresholded use.
19.6.3 6.3 Verdict
The spike kills the Tier-A leading-signal hypothesis. Connectedness here is a coincident echo of realised volatility with low marginal information, blind to equity-specific selloffs, and sensitive to universe composition. It is not worth a producer as an early-warning / regime signal. This is the intended outcome of a cheap spike: the strongest recommended path was falsified before any code shipped.
Scope honesty: this tests the time-series / systemic use (Tier A) only. It does not test the cross-sectional crowding / clustering use (Tier B — network centrality of individual holdings), which remains unexamined and is the only surviving rationale for network work here — pending its own spike (§4, next step 2). Also unswept: VAR lag order, window length, FEVD horizon, and alternative stress definitions (drawdown / VIX) — but the coincident signature is strong and consistent enough that tuning is unlikely to reverse it.